TOPIC 4 · MAJOR ASSIGNMENT 2 · COMPONENT 01/ Financial Literacy / major assignment / income and projection
01BLS data, a best-fit line, and a five-year forecast.
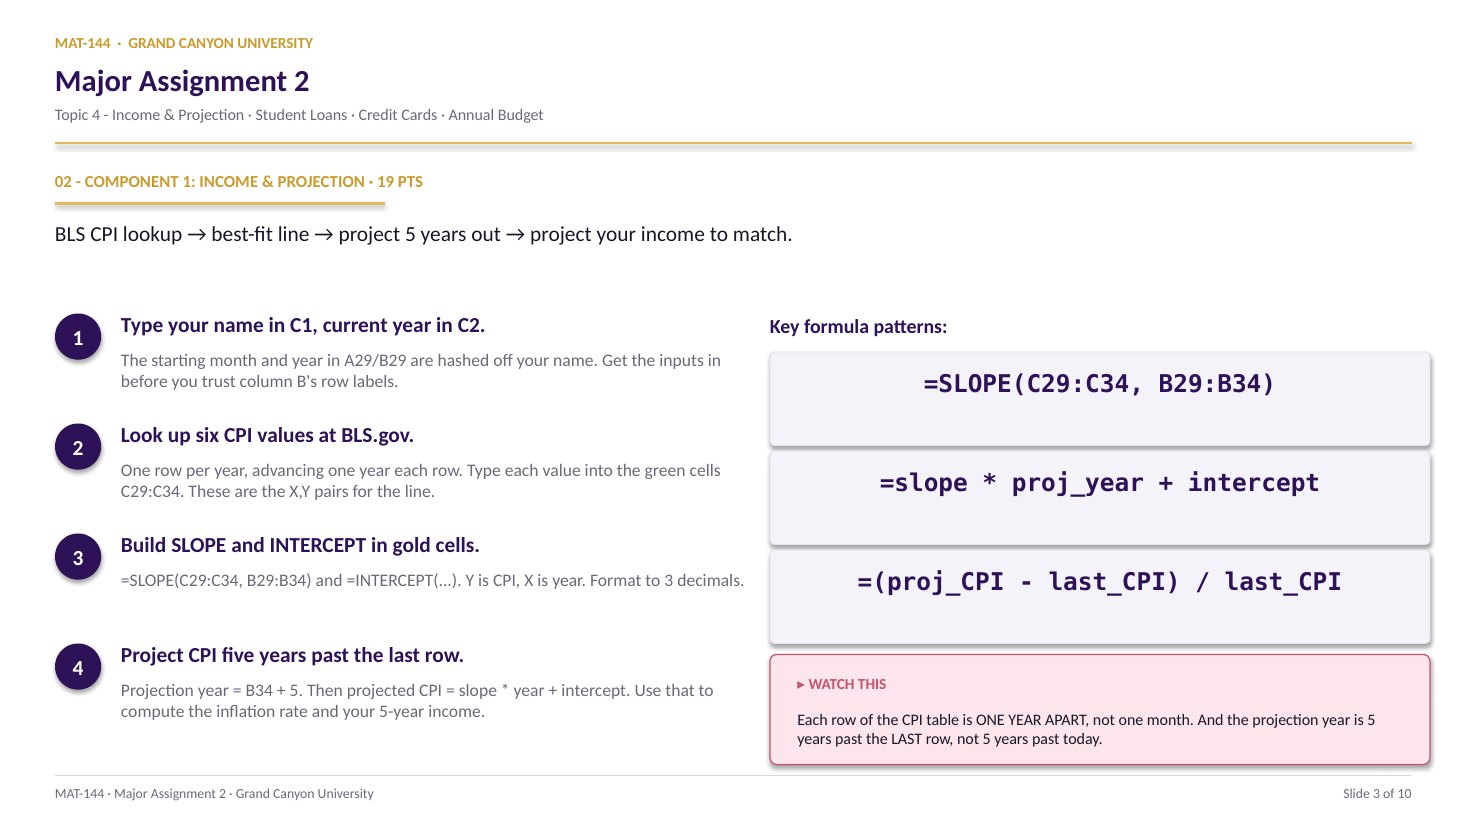
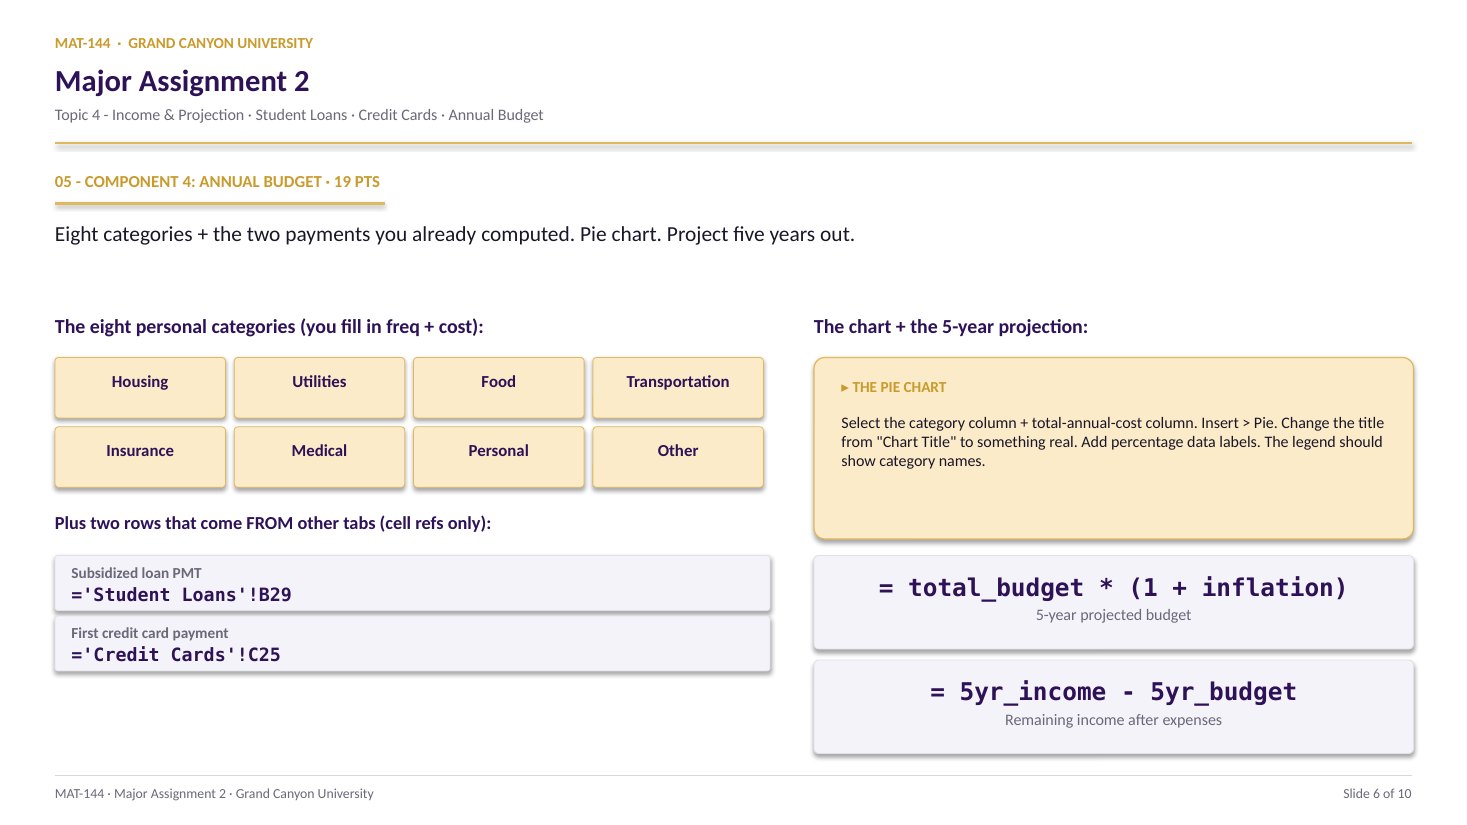
Look up six CPI values from the BLS for a personalized month/year sequence, fit a line with =SLOPE() and =INTERCEPT(), project five years past the last row, then scale your income by the implied inflation rate.
Major Assignment · 19% of Excel
BLS CPI lookup
=SLOPE() · =INTERCEPT()
A 7-page MA2 Walkthrough PDF covers all four components in the same hint depth as this page. Useful if you'd rather print, annotate on paper, or keep it open on a second screen while working in Excel.
Walkthrough video coming in a future recording. Until then, work from the slideshow above and the printable PDF.
SCRIBE.HOW · YOUTUBE
≡
Step-by-step walkthrough
Coming soon. Check back after the Scribe is recorded.
▸
Video walkthrough
Coming soon. Work from the slideshow and printable PDF until then.
Same three formulas as MA1 Component 1: =SLOPE(), =INTERCEPT(), and a forecasting trendline off a scatter plot. The MA1 workflow used BLS education-vs-income data; MA2 C1 applies the same moves to your own projected career income over five years. If MA1 C1 landed, this is the same shape on a different dataset — skip ahead if the workflow feels familiar.
The attached video is Topic 1 DQ 2’s walkthrough (SLOPE/INTERCEPT applied to the same scatter/trendline setup) — the DQ-level version of the same math, worked on video.
Same walkthrough, three modes.Pick the one that lands for you today.
ORIENT
· the tab
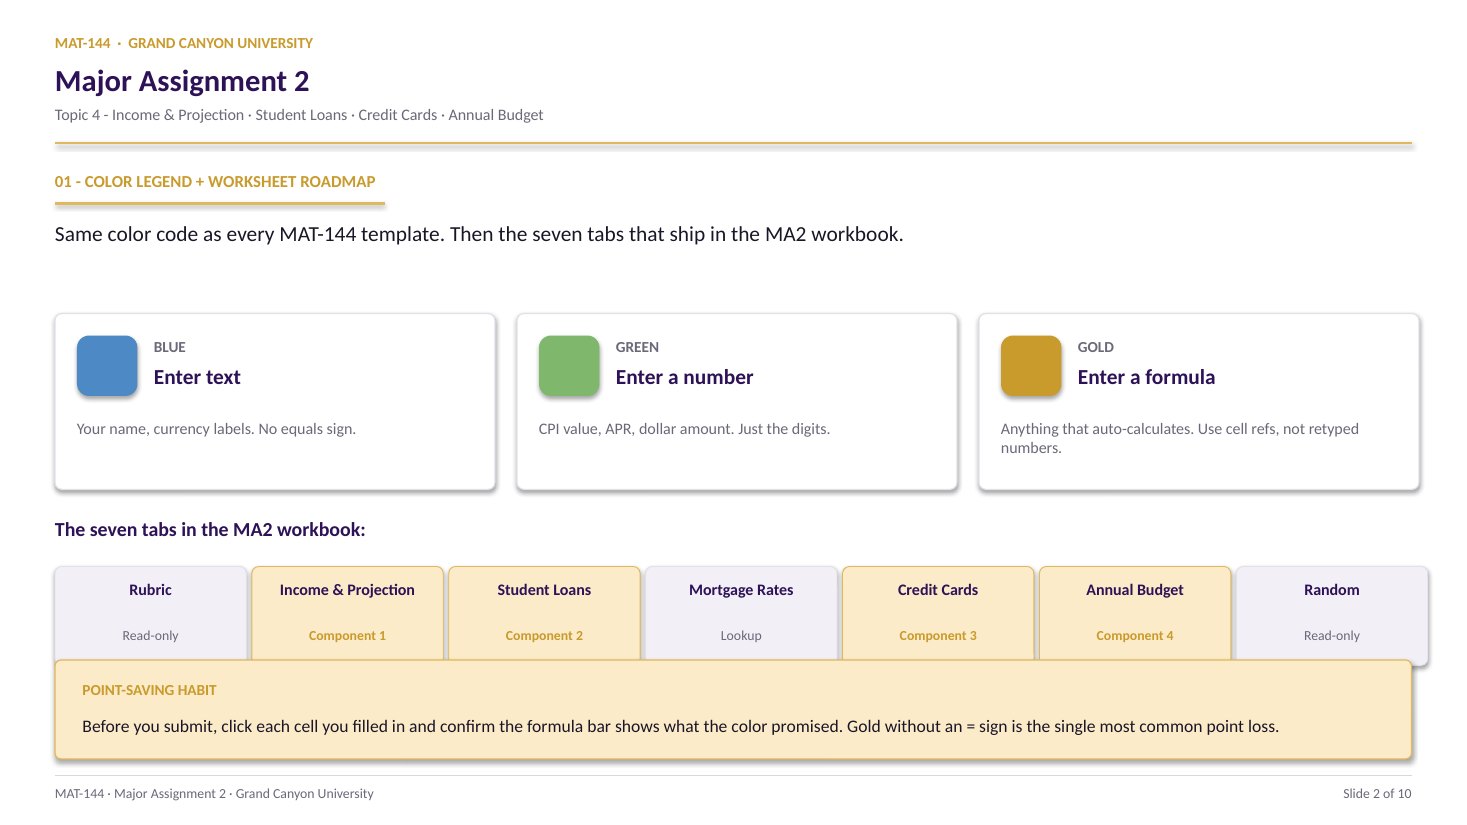
Name first, then six CPI values, then the projection.
Cell C1 (your name) seeds every personalized value on the tab. Cell C2 (the current year) anchors the time axis. Then comes the six-row CPI table and the gold formulas.
Your full name in C1 (blue cell, at least 10 characters) and the current year in C2 are the blue inputs. Until both are filled, every other personalized value on the tab reads “Enter your name in C1.” Once they are in, A29:B34 spawns your personalized six-month sequence and you can start looking up CPI values.
§1 · CPI table
A29:C34 - six rows, one year apart.
Columns A and B (auto-populated) give you a personalized month and year sequence. Each row advances +1 year. Column C is green - you type in the BLS CPI value for that month/year.
§2 · Best-fit line
K19 (slope) and K20 (intercept).
Use =SLOPE(C29:C34, B29:B34) and =INTERCEPT(C29:C34, B29:B34). Y first, X second. Format as Number with 3 decimals.
§3 · Five-year projection
C35, C36, C37 - CPI, inflation, income.
Project CPI five years past the last row (B34 + 5, not today + 5). Compute the (new - old) / old inflation rate. Scale your current income forward by one plus that rate.
CONCEPTS · six things to know
The five moves you’ll make.
BLS lookup → line of fit → project → rate → scale. Click cells, never type numbers. Lock with $ signs so formulas copy clean.
01
BLS
Look up your six CPI values at the source.
Go to bls.gov/cpi - the CPI-U (All Urban Consumers, U.S. city average) table. Columns A and B in the workbook (rows 29-34) already list your six month/year pairs - personalized off your name. Find each one on the BLS table and type the value into column C.
Type all the digits the BLS gives you (typically three decimal places, like 258.115). Inflation rates compound; small CPI errors become larger projection errors. Don’t round in column C - format-rounding happens downstream.
A
B
C
7
label
a
b
8
12
7
9
sum
=B8+C8
19
change B8→ C9 follows
02
Slope
=SLOPE(C29:C34, B29:B34) - Y first.
Goes in gold cell K19. Y-range first (CPI values in column C), X-range second (years in column B). The function returns the slope of the best-fit line through all six pairs - CPI points gained per year.
Format as Number with 3 decimal places. A reasonable result is something like 4.8 to 9.0 depending on the years in your table. If you see 0.15 or so, you flipped the arguments.
=SUM(E21:E28)
=Switch on
SUMFunction name
( )Argument hold
E21:E28Range arg
03
Intercept
=INTERCEPT(C29:C34, B29:B34) finds b.
Same shape as SLOPE: Y first, X second. Goes in gold cell K20. INTERCEPT returns the predicted CPI when the year is zero - a wild extrapolation, but a useful parameter for the line equation.
Format as Number with 3 decimal places. The value will be a large negative number (something like -9000); don’t panic, that’s geometry, not a CPI prediction.
=SUM(E21:E28)
=Switch on
SUMFunction name
( )Argument hold
E21:E28Range arg
04
Project
Five years past the last row, not five years past today.
The projection year goes in cell B35: read the year in B34 and add 5. Then project CPI into C35 with the line equation: =K19 * B35 + K20.
Lock the slope and intercept cells with dollar signs ($K$19, $K$20) if you copy the formula anywhere - it’s a habit worth keeping even for a single-cell formula. Format C35 as Number with 3 decimals.
=$K$19 * B35 + $K$20
Slope and intercept locked. B35 = year in B34 + 5.
Type =B34+5 in B35 - reference, never retype.
05
Rate
Inflation rate = (new - old) / old.
Goes in gold cell C36: =(C35 - C34) / C34. Compares projected CPI to last-row CPI - new minus old, divided by old. Same percent-change pattern from Topic 3.
Format as Percentage with 2 decimal places. For a five-year window in a normal economy, expect something around 15% to 25% total (not annual). If the cell shows 0.04%, the formatting is wrong - you formatted a percent as a percent twice.
a + b
↓
a+b
Plus
a − b
↓
a-b
Minus
a × b
↓
a*b
Asterisk
a ÷ b
↓
a/b
Slash
ab
↓
a^b
Caret
06
Scale
Five-year income = current income × (1 + rate).
Goes in gold cell C37: =current_income_cell * (1 + C36). The 5-year income scales your current annual income up by one plus the inflation rate. Monthly income (next cell) divides C37 by 12.
Format as Currency, no decimals. This 5-year monthly income carries forward - the Annual Budget tab (Component 4) references it for the “can I afford this?” comparison at the end.
Stored in cell
1.1428571428571428
Displayed (2 dec.)
1.14
Common slips
Four mistakes that cost the most points.
The CPI lookup is where most students stall first. Three of these four are caught by reading the formula bar before you submit.
01
Used today as the projection year.
The projection is five years past the last row of the CPI table (B34 + 5), not five years past the current year. Type =B34+5 in B35 - never retype.
02
Rows didn’t advance one year each.
The sequence in column B should step +1 year per row. If your table has six rows in the same year (just different months), the slope will be huge or undefined. Six months across six different years is the assignment.
03
SLOPE arguments reversed.
=SLOPE(X, Y) returns the reciprocal of the right answer - tiny instead of mid-single-digits. Y first, X second. Same for INTERCEPT.
04
Inflation rate typed as a decimal.
Even if 0.04 is the right number, the grader audits the formula bar. Stack the formula: =(C35-C34)/C34. Self-check needs both: right answer AND a real formula.
Application & connection
This is Topic 1 modeling + Topic 3 CPI in one tab.
This component is Topic 1 modeling wearing Topic 3 CPI clothes. The line of fit is the same best-fit-through-points move you used on weekly-income data in MA1. What changed is the source data (BLS CPI table instead of BLS income survey) and the meaning of the slope (CPI points per year instead of dollars per year of education).
The output of this tab - the projected monthly income - is the input the budget tab (Component 4) uses to ask “can I afford this in five years?” Get this tab right and the budget side gets easier.