TOPIC 7 · DQ 1 / Taxes & Stocks / discussion question

01Two stocks. Five snapshots. One year.

Pick two real stocks from Yahoo Finance whose tickers start with your initials. Record closing prices at 1 year, 9 months, 6 months, 3 months, and today. Compute initial investment with a flat purchase fee; track value and gain/loss at each snapshot; roll up to a total per period.

Discussion · 5 pts Initial post Wed · replies Sun Yahoo Finance shares × price
1
Step 1 · materials
Download the worksheet

Topic_7_DQ_1.xlsx

XLSX 5 pts v · spring 26
2
Step 2 · walkthrough
Watch the click-by-click

Every keystroke for the Stocks tab. The Scribe walkthrough lands here once recorded; for now, the Excel template above is your working surface.

SCRIBE.HOW · YOUTUBE
Step-by-step walkthrough
Coming soon. Check back after the Scribe is recorded.
Same walkthrough, two modes. Use whichever helps you today.
ORIENT · the worksheet

What's actually on the sheet.

One tab (Stocks). Two stocks across five time points produce ten value cells and ten gain/loss cells, all driven by Excel formulas referencing the initial-investment cells at the top.

Open the Stocks tab. Type your name in cell A13. Use finance.yahoo.com to find two stocks whose ticker symbols start with the first letters of your first and last name. Record the ticker, the purchase date (approximately one year ago), and the closing price for each stock in rows 15–16. Compute the initial investment in column I using =F15*G15 + H15 (shares × price + fee). Then look up closing prices at approximately 9 months, 6 months, 3 months, and today; type them into the second table. Use Excel formulas to fill the value and gain/loss columns for each stock, then the total gain/loss column at the right. Format all prices and investments as Currency with 2 decimal places, and all dates as Date. New to the cell color codes? See the legend.

§1 · Pick the stocks

First name + last name letters.

Yahoo Finance → search by ticker. First stock starts with first letter of first name; second with first letter of last name.

§2 · Initial investment

<code>=shares &times; price + fee</code>.

100 shares plus $5 fee for stock 1; 200 shares plus $10 fee for stock 2. The fee is paid once and never again.

§3 · Five snapshots

1 yr · 9 mo · 6 mo · 3 mo · today.

Pull closing prices from Yahoo Finance for each date. Type the prices into column F (stock 1) and column M (stock 2).

§4 · Value + gain/loss

<code>=E*F</code>, then <code>=value &minus; $I$15</code>.

Value = shares × price (no fee). Gain/loss = value − initial investment, with the initial cell locked.

§5 · Total + format

Sum across stocks; Currency / Date.

Column Q totals the two stocks' gain/loss per row. Format all dollar cells as Currency with 2 decimals; all date cells as Date.

CONCEPTS · six things to know

The why behind every cell.

Five panels: the stock-picking constraint, the initial-investment formula, the timeline of five snapshots, the value-and-gain/loss pairing, and the portfolio-level total roll-up.

01
Stock picks

First name + last name initials.

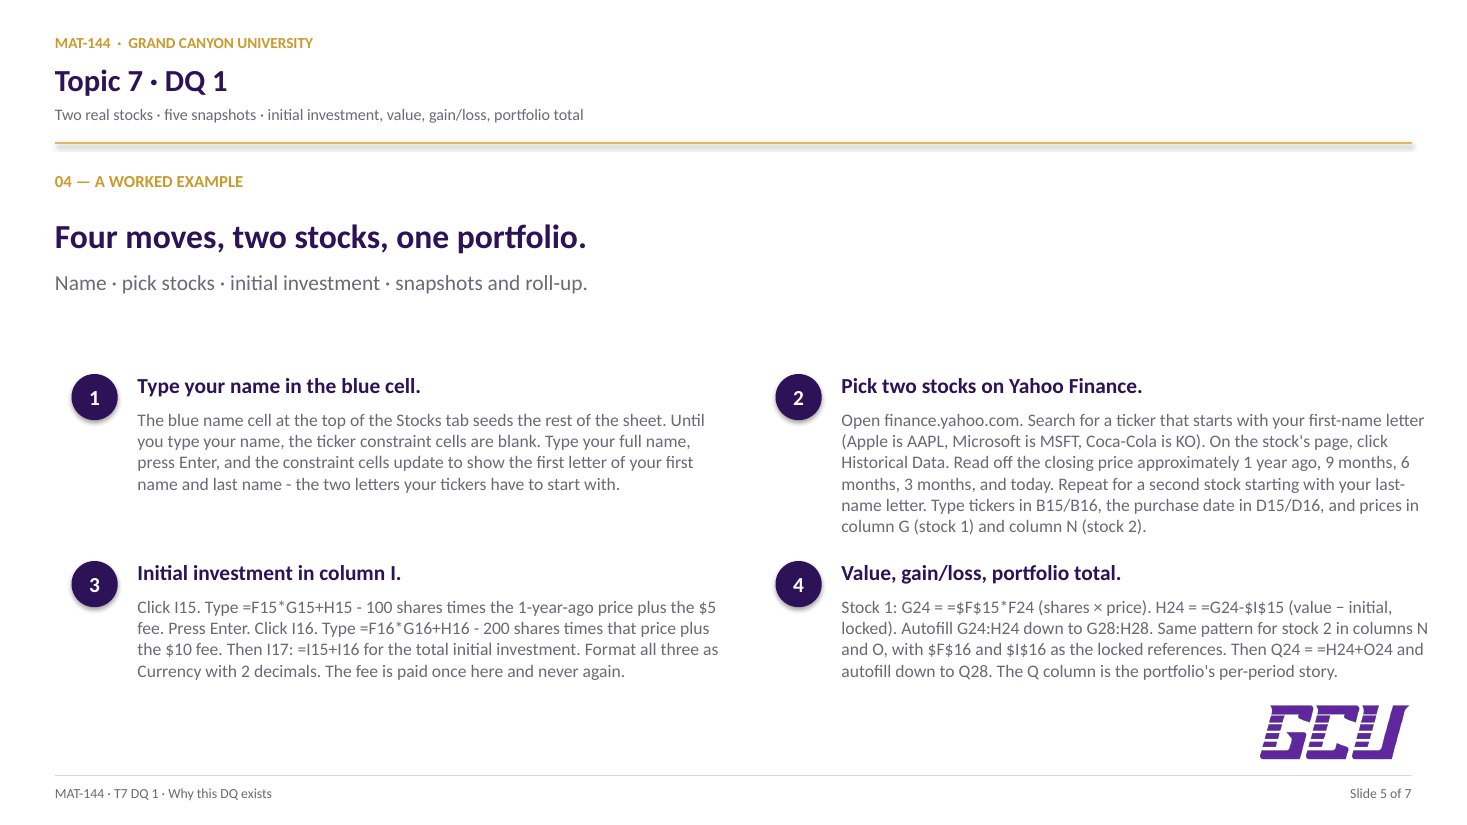
The first move is picking two stocks whose ticker symbols begin with specific letters: the first stock's ticker must start with the first letter of your first name, and the second stock's ticker must start with the first letter of your last name. The constraint guarantees a unique pair per student (and prevents copy-and-paste across the class).

The recommended source for the data is Yahoo Finance (finance.yahoo.com). Search for a ticker symbol starting with the required letter (Apple is AAPL, Coca-Cola is KO, Microsoft is MSFT, and so on), pull up the stock's page, switch to the “Historical Data” tab, and read off the closing price for each of the five dates required: approximately 1 year ago, 9 months ago, 6 months ago, 3 months ago, and today.

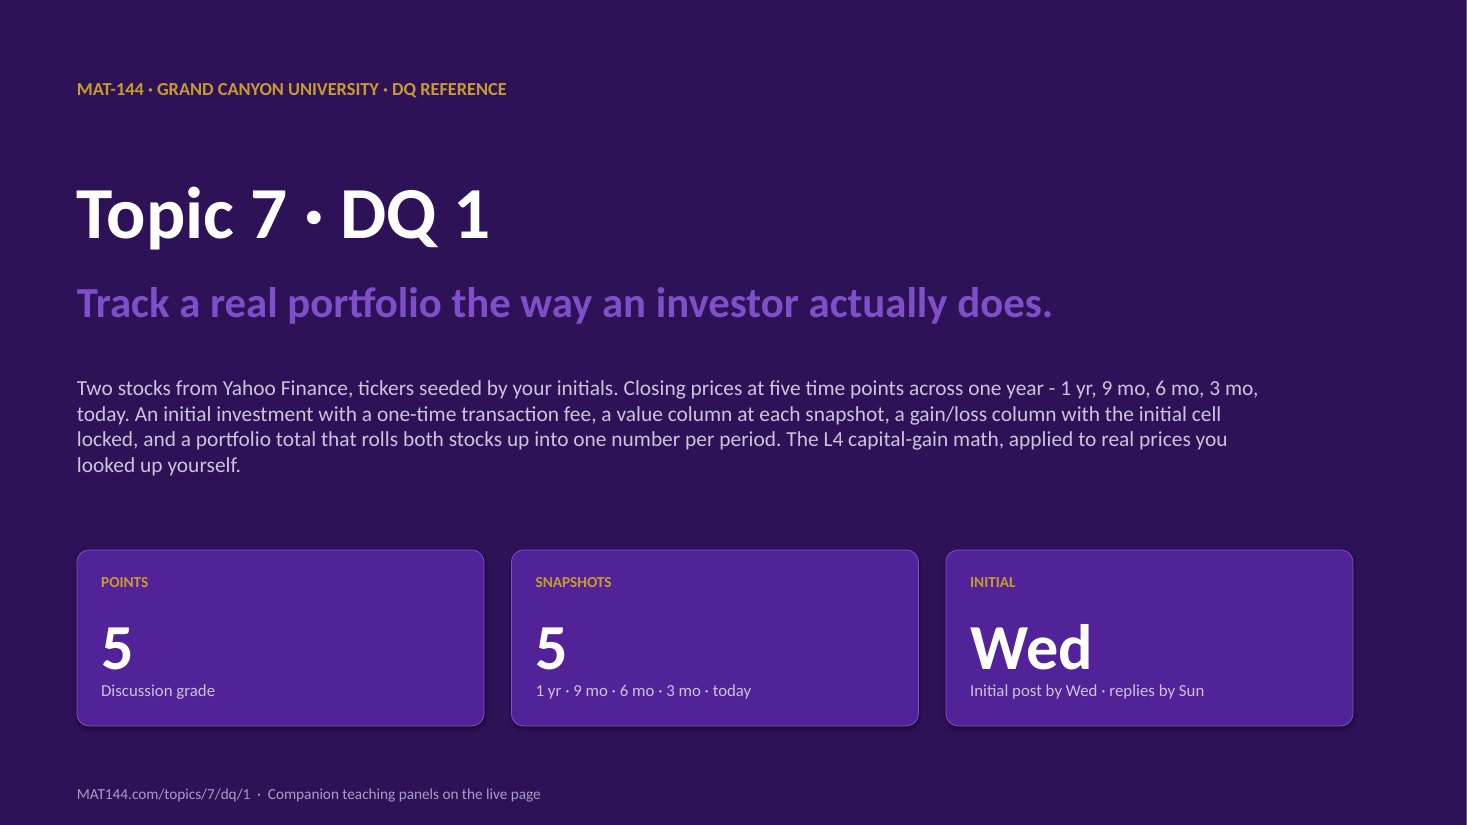
You'll record 100 shares of the first stock (with a flat $5 transaction fee) and 200 shares of the second (with a flat $10 fee). The shares and fees are pre-filled in the template; your job is the dates, ticker symbols, and closing prices.

02
Initial investment

Shares × price + fee, once.

The initial investment is what you paid on the day of purchase: the cost of all the shares plus the one-time transaction fee. For 100 shares of a stock at $50 per share with a $5 fee, the initial investment is =100*50 + 5 = $505.

In the template, the formula in cell I15 (first stock's initial investment) is:

=F15*G15 + H15

which translates to shares × closing price + fee. The corresponding formula for the second stock in I16 is =F16*G16 + H16. The total investment in cell I17 sums both: =I15+I16. Format all three as Currency with 2 decimal places so they read as “$X, XXX.XX” instead of bare numbers.

initial investment = shares × price + fee
I15 = F15 × G15 + H15  (stock 1)
I16 = F16 × G16 + H16  (stock 2)
I17 = I15 + I16  (total)
Three formulas. The fee is paid once and never again.
03
Five snapshots

1 yr · 9 mo · 6 mo · 3 mo · today.

For each of the five time points, the position value is shares × that date's closing price — without the fee. The fee was paid once on purchase day; it is not paid again at every subsequent valuation. Confusing this is the most common slip on the assignment.

In cell G24 (first stock, 1 year ago), the formula is:

=E24*F24

where E24 contains the shares (auto-pulled from $F$15 = 100) and F24 contains the closing price you typed in. As you autofill the formula down to G25, G26, G27, G28, the row references advance to pick up each new date's price, but the share count stays at 100 because of the absolute reference to $F$15 in column E.

Repeat the same pattern for the second stock in column N (rows 24–28), using shares from $F$16 = 200. Format every value cell as Currency with 2 decimal places.

FIVE TIME POINTS · ONE YEAR 1 yr initial ($5,005) 9 mo $5,200 +$195 6 mo $4,800 −$205 3 mo $5,400 +$395 today $5,600 +$595 stocks zigzag — one period's loss is another's gain
04
Gain/loss per period

Value − initial, locked.

The gain/loss at each time point is the current value minus the initial investment. A positive number means the position is worth more than you paid for it (a gain); a negative number means it is worth less (a loss).

For the first stock at the 1-year-ago time point, the formula in H24 is:

=G24 − $I$15

The current value G24 drifts row-by-row as you autofill down to H28, but the initial investment $I$15 stays locked — it was paid once at purchase and never changes. Same pattern for the second stock in column O with $I$16 as the locked denominator-equivalent.

The first row will always show a gain/loss of $0 (or very close to it), because the “1 year ago” value is the initial investment minus the fee. The interesting numbers are in rows 25–28, which show how the position's value drifted away from the initial cost over time.

value at each date = shares × that date's price
gain/loss = value − initial investment
total gain/loss = stock 1's + stock 2's per period
Three formulas, applied at every time point. The fee is in the initial investment but not in the value.
05
Portfolio roll-up

Total = stock 1 + stock 2.

The total gain/loss across both stocks is the sum of the two per-stock gain/loss columns at each time point. In cell Q24:

=H24 + O24

Autofill down to Q28. The total tells the portfolio story: in some quarters one stock may compensate for the other's losses, in others both move in the same direction. Real portfolios behave this way constantly, which is one of the practical reasons the diversification concept from Lesson 6 matters — two stocks alone provide some diversification, but the benefits scale up dramatically with more positions and multiple asset classes.

Format the Q column as Currency with 2 decimal places. At submission, the portfolio's net story is visible at a glance in this single column.

Common slips

Five mistakes this DQ punishes.

Adding the fee at every period and reversing the gain/loss sign are the most common. Read these before you submit.

  1. 01
    Added the transaction fee to every period's value, not just the initial investment.

    The $5 (and $10) fees were paid once on purchase day. They belong in the initial investment formula =F15*G15 + H15, but the per-period value formula is just =shares × price. If you add the fee every time, you'll never see a gain, because the fee is being double-counted against you.

  2. 02
    Computed gain/loss as initial − current instead of current − initial.

    Positive gain/loss should mean the position is worth more than you paid for it. The formula is =value − initial, not the other way around. The reversed-sign version will show losses when there are gains and vice versa.

  3. 03
    Hardcoded the share count into the value formula.

    The shares are pre-filled in F15 (100) and F16 (200). The value formula should reference those cells with absolute references ($F$15, $F$16), not type the numbers directly. Hardcoded values mean the formula breaks if the template ever updates the share counts.

  4. 04
    Forgot to lock the initial-investment reference in the gain/loss formula.

    When you copy the gain/loss formula from H24 down to H25, H26, etc., the value reference (column G) should drift forward to pick up each period's value, but the initial-investment reference ($I$15) should stay anchored. Without the $, the formula references I16, I17, … on the way down — all the wrong cells.

  5. 05
    Didn't format the cells as Currency / Date.

    The grader explicitly checks formatting. Dollar amounts (initial investment, prices, values, gains/losses) should show as $X,XXX.XX with two decimal places. Dates should show as dates (e.g., May 13, 2025), not as serial numbers. Use Excel's Number format menu: Currency for dollars (2 decimals) and Date for dates.

Application & connection

From this DQ into DQ 2 and the Final Exam.

This DQ is the equity half of Topic 7's investing focus. Lesson 4 introduced the capital-gain math (value = shares × price, gain = value − initial investment); this DQ applies it to two real stocks of your own choosing and tracks their performance across five time points covering the full year. The transaction-fee piece is new: the lesson described it abstractly, but here you see it explicitly added to the initial investment and (importantly) not added to the period values, because the fee was paid once at purchase and is not paid again at every subsequent valuation.

The bridge to DQ 2 is the question of taxes (the other half of Topic 7). DQ 1 stays inside the stock market; DQ 2 will turn to the federal-income-tax math from Lessons 1–3 in a similar hands-on form. Together the two DQs translate the full topic — both taxes and investing — from abstract lesson math into a real spreadsheet you would actually use to track your own finances.

One useful next step: keep the spreadsheet. Add more rows for the next year, repeat the exercise, and you have the start of a real personal investment journal — the same workflow a serious individual investor uses to track their own portfolio over time.