TOPIC 5 · DQ 1 / Statistics / discussion question

01Five descriptive measures. Then a 68% band.

117 wells, two columns of data, five built-in functions, and one Empirical-Rule sentence at the end. By the time you submit, you'll be reading center, spread, and a 68% band the way a statistician does.

Discussion · 5 pts Initial post Wed · replies Sun =AVERAGE =PERCENTILE.INC
1
Step 1 · materials
Download the worksheet

Topic_5_DQ_1.xlsx

XLSX 5 pts v · spring 26
2
Step 2 · walkthrough
Watch the click-by-click

Every keystroke for the Improvement tab. The Scribe walkthrough lands here once recorded; for now, the Excel template above is your working surface.

SCRIBE.HOW · YOUTUBE
Step-by-step walkthrough
Coming soon. Check back after the Scribe is recorded.
Same walkthrough, two modes. Use whichever helps you today.
ORIENT · the worksheet

What's actually on the sheet.

One tab does almost all the work (Improvement). The data appears as soon as you type your name. Same color legend as the loan DQs.

Open the Improvement tab. Type your name in the blue cell at the top — that triggers the NORM.INV formulas in columns D and E to generate your personalized 117-well data set. Compute Mean, Median, Standard Deviation, and Range for both the Before and After columns. Autofill the Improvement column (=E4-D4 → drag down to row 120). Then compute the same five measures on Improvement, plus the 16th and 84th percentiles. Finally, complete the Empirical-Rule sentence using your computed values. New to the cell color codes? See the legend.

§1 · Type your name

The data appears.

The Before / After columns are formulas that depend on cell E2. Until you type your name, they display "Enter your name" as a placeholder.

§2 · Before / After stats

Five descriptive measures.

Mean, median, SD, range for each of the two columns. Use =AVERAGE, =MEDIAN, =STDEV.P, and =MAX-MIN for range.

§3 · Improvement column

<code>=E4-D4</code>, then autofill.

After minus Before. Negative values mean the treatment reduced E. coli — the intended direction. Autofill all 117 rows.

§4 · Percentiles + sentence

16th, 84th, then read the conclusion.

PERCENTILE.INC at 0.16 and 0.84 brackets 68% of the Improvement data — exactly the Empirical Rule's inner band. Fill the sentence: number, direction, two bounds.

CONCEPTS · six things to know

The why behind every cell.

Five panels: the descriptive-function toolkit, the Improvement formula, the 16th-84th percentile band, the Empirical Rule itself, and the conclusion sentence that turns numbers into a claim.

01
Descriptive toolkit

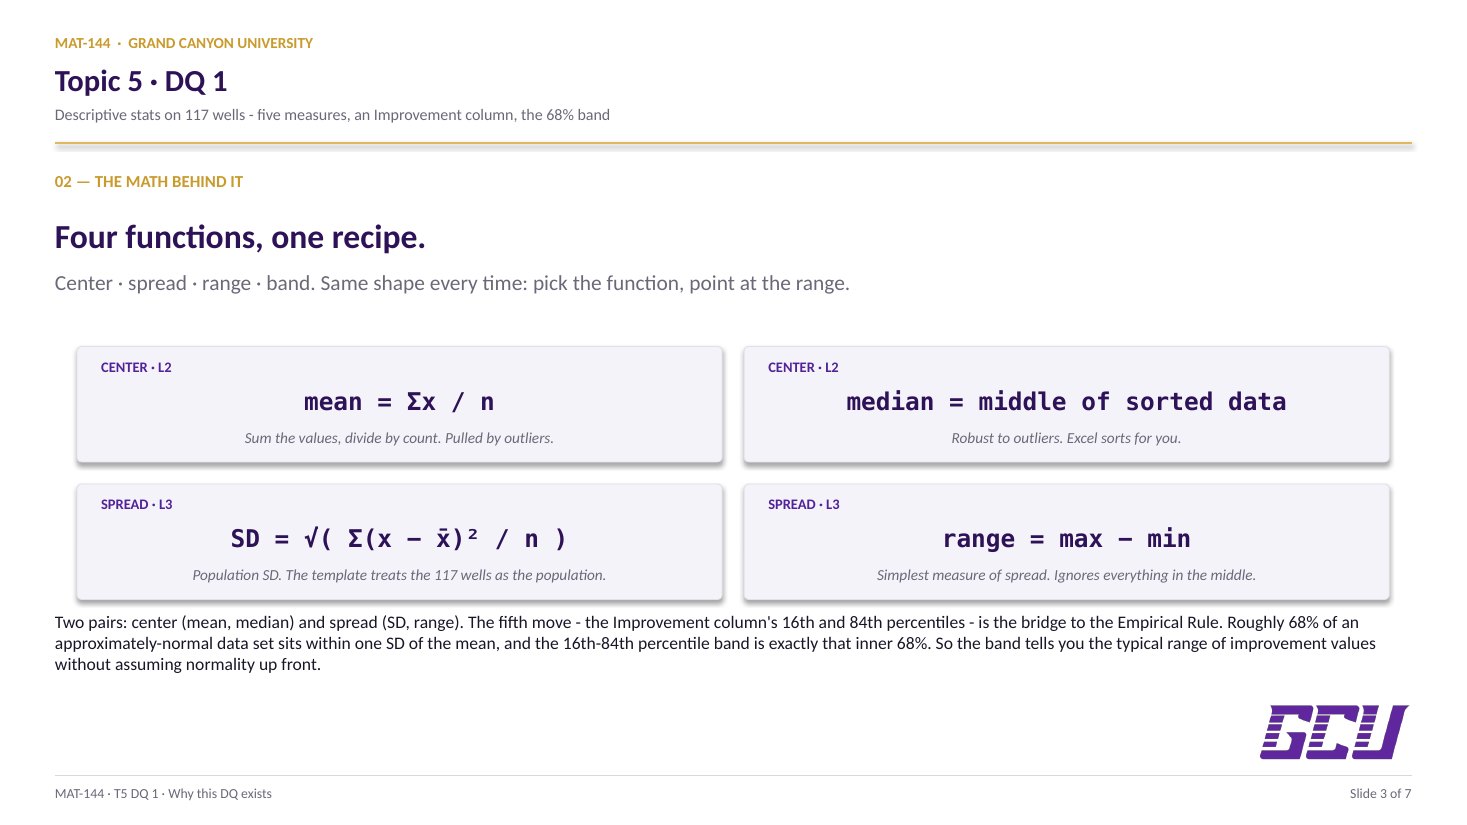
Five functions, one recipe.

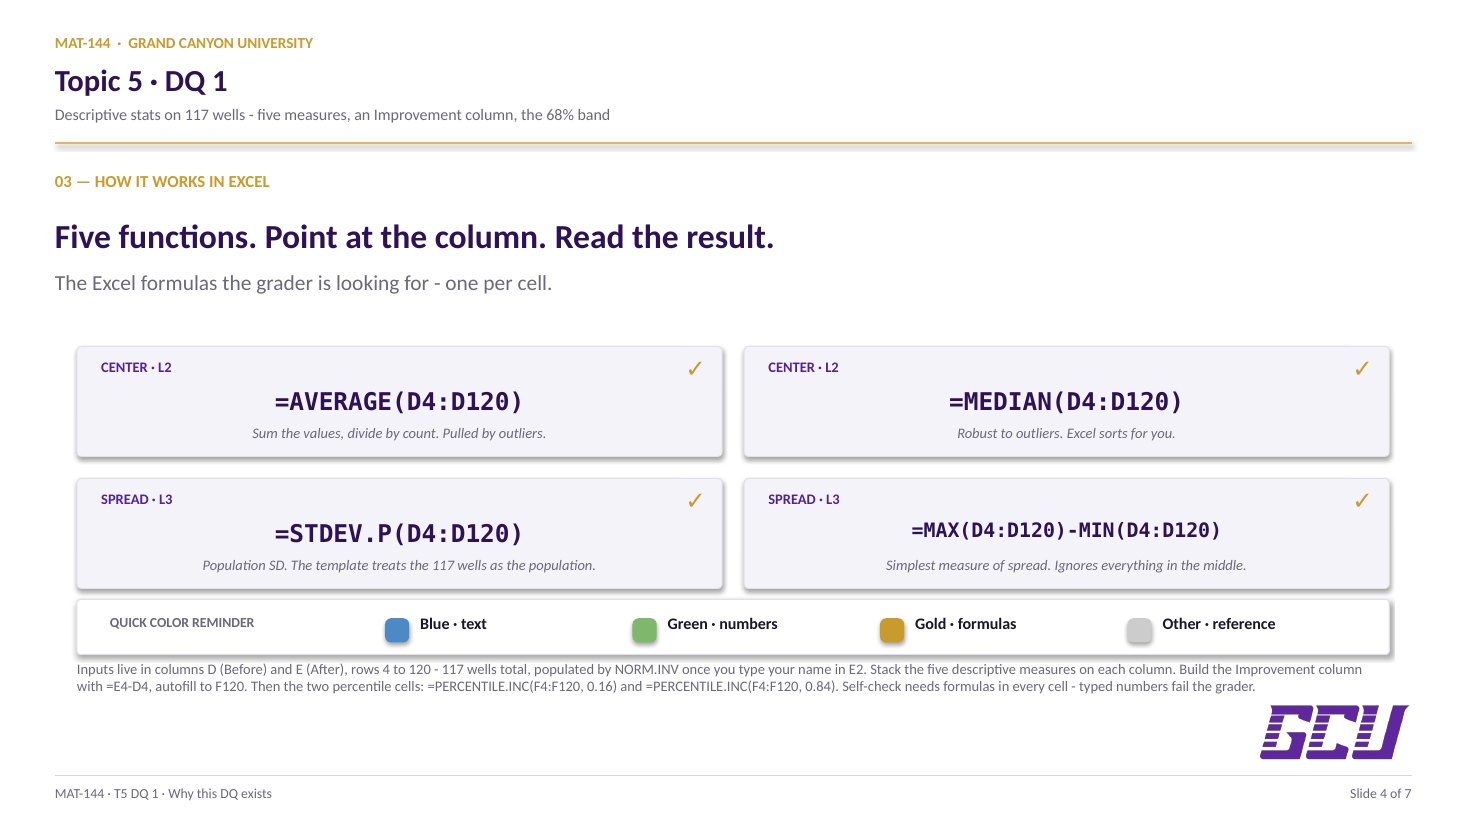
Five built-in functions handle every descriptive measure in this DQ. Each one takes a range — the column of data — and returns the single number that summarizes it.

=AVERAGE(D4:D120) for the mean. =MEDIAN(D4:D120) for the middle. =STDEV.P( D4:D120) for the population standard deviation (this template treats the 117 wells as the full population, not a sample). And the range is computed by hand: =MAX(D4:D120)-MIN(D4:D120).

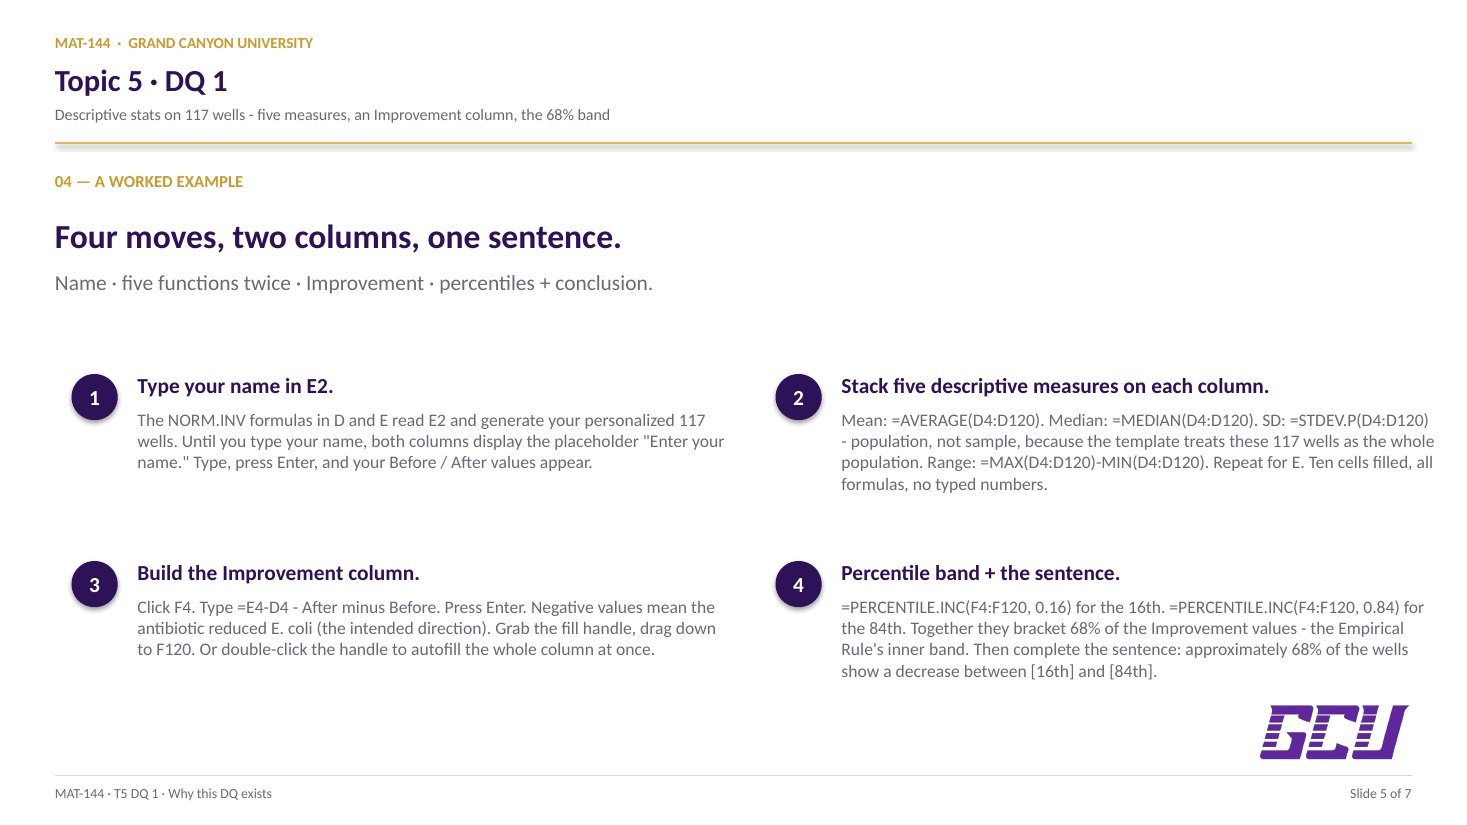
The same five formulas work on the After column (E4:E120) and on the Improvement column (F4:F120). Type once, copy across — the column reference is the only thing that changes.

=AVERAGE(D4:D120) → mean
=MEDIAN(D4:D120) → median
=STDEV.P(D4:D120) → population SD
=MAX(D4:D120) − =MIN(D4:D120) → range
Same recipe in three columns: Before, After, Improvement.
02
Improvement column

After − Before, autofilled.

The Improvement column is derived from the Before and After columns. For each row, the formula is =E4-D4: After minus Before. Type that in F4, then double-click the fill handle (the small square at the bottom-right of the cell) to autofill all 117 rows.

The sign tells the story. If treatment worked, After is smaller than Before, and Improvement is negative — the well now has fewer E. coli per mL. A positive Improvement value means E. coli went up, which is the opposite of what we were hoping the antibiotic would do.

Don't reverse the order. =D4-E4 would give the same magnitudes with opposite signs, and every conclusion in Task 5 would flip.

F4 = E4D4
After − Before, autofilled F4:F120
Negative values = E. coli went down (treatment worked). Positive = went up.
03
Percentile band

16th and 84th bracket 68%.

The 16th and 84th percentiles bracket a 68% band — the middle two-thirds of the data, by count. For a roughly normal distribution, this band corresponds to ±1 standard deviation around the mean (the inner band of the Empirical Rule).

Excel computes percentiles directly: =PERCENTILE.INC(F4:F120, 0.16) for the 16th, =PERCENTILE.INC(F4:F120, 0.84) for the 84th. The function sorts the data, walks 16% (or 84%) of the way through, and returns the value at that position — interpolating linearly when the position falls between two data points.

Why 0.16 and 0.84 specifically? Because 84 − 16 = 68, which matches the "approximately 68% within ±1 σ" from Lesson 5. The Empirical Rule is the math behind the choice of cut points.

PERCENTILE BAND · 16TH TO 84TH = 68% 16th 84th 68% about 80 of 117 wells live in this band
04
Empirical Rule

68 — 95 — 99.7.

The Empirical Rule says that for any data set that is approximately normal (bell-shaped), roughly:

  • 68% of the values fall within ±1 standard deviation of the mean
  • 95% within ±2 standard deviations
  • 99.7% within ±3 standard deviations

This DQ uses the 68% layer. The 16th and 84th percentiles you just computed mark the boundaries of that inner band: roughly two-thirds of the 117 wells will show an Improvement value between them. The other third lives in the tails — the wells where the antibiotic did much more (or much less) than typical.

THE 68-95-99.7 RULE 68% 16th 84th mean tail tail
05
THREE OUTCOMES · BASED ON WHERE THE BAND SITS 0 DECREASE band entirely negative 0 INCONCLUSIVE band straddles zero 0 INCREASE band entirely positive For this DQ: improvement values are mostly negative → DECREASE in E. coli.
Reading the conclusion

Increase, decrease, or inconclusive.

The final sentence is where statistics turns into a claim. The template gives you the skeleton: "Approximately ___ of the 117 wells show an [increase/decrease/inconclusive] of between ___ and ___ E. coli per mL."

The blanks fill from the work above. The number is about 80 (68% of 117 ≈ 79.6). The direction is decrease — the antibiotic reduces E. coli, so Improvement values are negative and the correct verb describes the direction of change in E. coli, which is down. The lower and upper bounds are the 16th and 84th percentile values you computed (both will be negative numbers in this scenario).

If the percentile values had bracketed zero — one negative, one positive — the correct word would be inconclusive: the inner 68% would contain both wells that got better and wells that got worse, and the treatment effect would not be confidently in one direction.

Common slips

Five mistakes this DQ punishes.

The sign-flip on Improvement and the STDEV.P vs STDEV.S confusion are the two most common. Read these before you submit.

  1. 01
    Used =STDEV.S instead of =STDEV.P.

    This template treats the 117 wells as the full population being studied, not a sample of a larger group. So use the population formula: =STDEV.P(D4:D120). The two functions differ only in the divisor (n vs n − 1), but for n = 117 the numerical difference is tiny — the grader still checks for the right function name.

  2. 02
    Computed Improvement as =D4-E4 (Before − After).

    The convention this template uses is After − Before: a negative number means the antibiotic reduced E. coli (the intended improvement). Reversing the order flips every sign in column F, which then flips your percentile bounds and breaks the conclusion sentence. Use =E4-D4.

  3. 03
    Forgot to autofill the Improvement column to row 120.

    Type =E4-D4 in F4, then either drag the fill handle or double-click it to autofill the formula down to F120. If you only fill the first few rows, your percentile and mean calculations will be wrong (you'll be averaging over an incomplete data set).

  4. 04
    Typed the percentile values manually instead of using =PERCENTILE.INC().

    The grader checks that the percentile cells contain formulas, not bare numbers. Use =PERCENTILE.INC(F4:F120, 0.16) for the 16th and =PERCENTILE.INC(F4:F120, 0.84) for the 84th. The function handles the sort + interpolation; you don't need to do it by hand.

  5. 05
    Wrote "increase" in the conclusion sentence.

    Improvement is negative when the antibiotic works (After is smaller than Before). The change in E. coli is a decrease. The word the sentence asks for describes the E. coli direction, not the goodness of the result — so "decrease" is the correct verb. "Inconclusive" would apply only if the 16th-84th band straddled zero.

Application & connection

From this DQ into the margin-of-error work in DQ 2.

This DQ is the data half of Topic 5. You're not just computing five numbers — you're learning to read what a data set says: where its center sits, how widely it scatters, and what percent of it lives inside a band you draw with the 16th and 84th percentile.

That last move is the bridge to DQ 2, which trades the percentile band for the formal margin of error on a sample proportion (the ± on every poll headline). Both DQs share the same engine: the normal distribution and the Empirical Rule. DQ 1 stays inside the data set; DQ 2 leaps from a sample to a much larger population.

From there, the chapter closer (Lesson 6) and the textbook chapter wrap the loop — you'll be able to read a research finding, a medical study, or a survey result and spot the descriptive piece, the inferential piece, and the distance the claim is willing to travel beyond the data on the page.